PasWITS - Passive Wireless Intelligence Tracking System
Abstract
Measuring the public interest in a particular product or service is highly important for the strategic planning of businesses. Livealytics provide an analytics solution for benchmarking the performance of sales and live marketing promotion activities, trade shows and retail spaces. Conducted use cases have demonstrated the technical feasibility of livealytics’ approach to benchmark the attractiveness of events and exhibitions based on signals emitted by mobile devices using wireless protocols such as 802.11b or 802.11g (2.4 GHz) or 802.11a (5 GHz). Results obtained allowed these companies to identify particular audience characteristics of event that may benefit future exhibitions.
Hence, research and engineering challenges were identified in order to improve and extend livealytics’ solution not only toward the passive capture of signals emitted by portable devices, but also for the analysis and prediction of exhibitions based on previous records of events and respective audiences. Engineering challenges include 1) broadening the scope of signal frame, based on Bluetooth protocols (when enabled) in their different versions, as well as 2) the unique identification of devices in the data link layer (MAC randomization). Research challenges include 3) the identification of attributes with discriminatory relevance for events, exhibitions, and audiences, as well as the definition a machine learning model for predicting how a particular event or exhibition would perform for a given audience.
General Information
| Reference: | Research and Industrial Project |
| Source of funding: | Inosuisse |
| Project Duration: | 03.04.2020 - 01.04.2022 |
Project partners
Approach
PasWITS explores two fundamental points from a business point of view: (1) the capture of passively device data and its identification, and (2) data correlation and visualization, which involves the correlation of devices and users and prediction of scenarios (i.e., prediction of events and exhibition performance).
(1) Capture of Bluetooth signals of different versions (starting from 4.0) combined with Wi-Fi sources as observed in the Figure above. Therefore, the passive signal receiver, i.e., the Bluetooth tags, must not only be compatible with recent versions boarded in new devices (e.g., Bluetooth 5.1), but also backwards compatible to intercept signals from a wide range of devices. This integration will allow to identify devices whose MAC randomization is enabled, thereby increasing the number of devices identified. It also provides the information baseline for challenges (1) and (2) to increase the accuracy of detection.
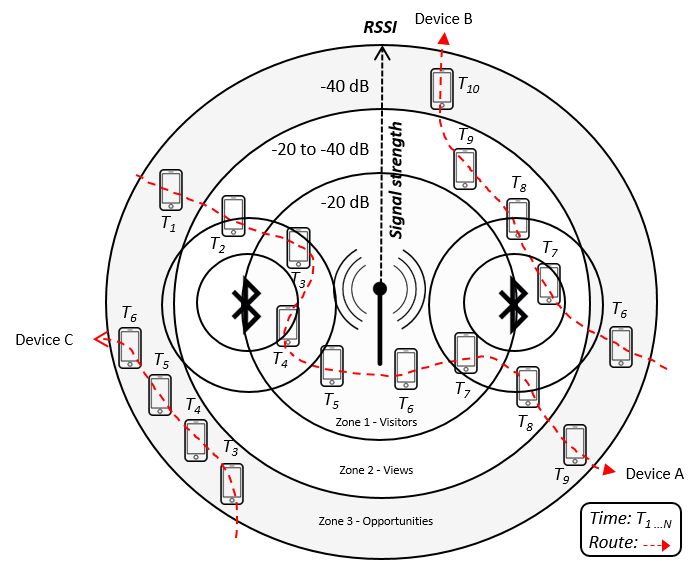
(2) Concerns the unique device identification and the correlation of device(s) to its users is considering that users might carry more than one device emitting wireless signals, and these devices can emit passive wireless signals through different sources (cf. Figure above). Thus, it is possible to enable the correlation of spatial and temporal dimensions through the RSSI signal strength captured from different sources (Wi-Fi and Bluetooth) measured in a given point in time and it is possible to determine with a higher likelihood the uniqueness of tracked devices. The major benefit of solving these challenges is to increase the precision of the calculated performance metrics based on accurate measurements.
PasWITS Architecture
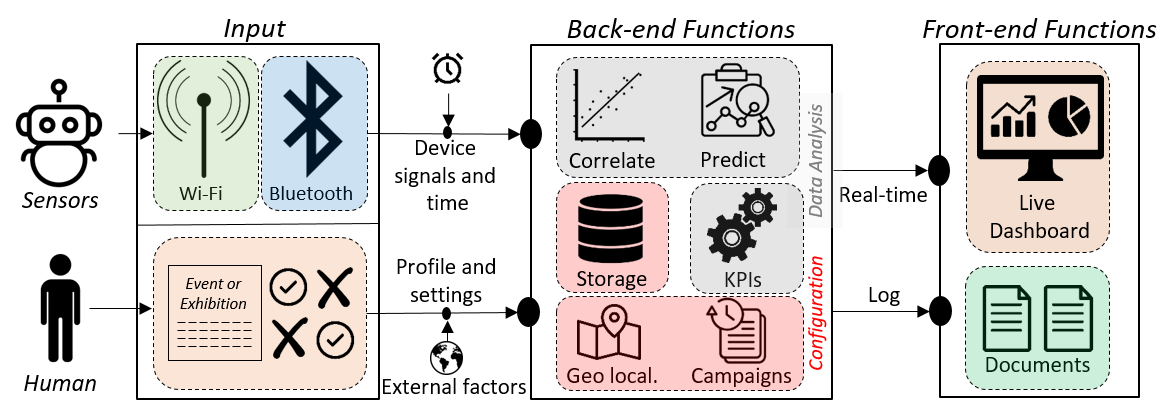
The Figure above depicts the architectural functions in the PasWITS system. The input requires the event or exhibition settings determining the specific configurations for each customer, as well as external factors that may influence the campaign (e.g., holidays, weather conditions and others). At a second stage, the data analysis involves predicting the performance of events or exhibitions based on previous data (i.e., estimate the success or failure probabilities by profiling events and exhibitions). At a third stage, visualizing KPI metrics on a dashboard enables real-time performance analysis of the event or exposure, allowing one to make adjustments on-the-run when possible. Possible solutions are:
- Analyzing the geographic synergy between the input vectors to determine whether the positioning of the signaling sources is overlapped with a certain probability during a time-frame. In this sense, in order to identify a single device, the Received Signal Strength Indication (RSSI) of the Wi-Fi signal emitted by devices can be measured as well as the proximity of a Bluetooth device using Bluetooth Low Energy tags (BLE tags). Based on the collected data, it is possible to determine movement patterns and estimate whether a device belongs to a user.
- Predicting event or exhibition performance involves profiling events and exhibitions by extracting relevant technical (anonymized KPI indicators) and non-technical (type of public, estimated purchasing power) characteristics to estimate the success of an exhibition at an event, or an event in a given region. In this sense, the solution can act proactively in recommending, for example, a particular event for the type of exhibition, or a region for a particular event.
- Viewing live KPIs requires an adjustable web framework with respect to defining geographic spaces and sensors positioning, as well as displaying metrics and indicators in a straightforward manner for the user. For example, the analysis of proximity by measuring the strength of emitted signals allows for the establishment of proximity zones, and to calculate user interest based on his or her proximity during a period of time. Also, it is possible to extract different metrics, such as dwell time (the time a person spends observing the exhibition), bounces, observers, and others.
Contact
Inquiries may be directed to the local Swiss project management:
Prof. Dr. Burkhard Stiller
University of Zürich, IFI
Binzmühlestrasse 14
CH-8050 Zürich
Switzerland
Phone: +41 44 635 67 10
Fax: +41 44 635 68 09